Measurement
Part of Check packaging marketing measurement before you report results
Which packaging marketing attribution methods actually work for UK brands?
Packaging marketing attribution methods compared for UK brands: QR codes, redemption codes and surveys, with a decision table and dated ONS and DMA evidence.
What to take away
- The ONS Internet users, UK2020 release was published on 6 April 2021. It reported that 94.8% of UK adults had used the internet in the three months before early 2020, so any packaging marketing attribution method sits inside a mostly online customer journey.
- Five methods carry most packaging marketing attribution work in the UK: per-unit QR codes, dynamic QR codes with a tagged landing page, GS1 Digital Link barcodes, loyalty redemption codes and post-purchase surveys.
- QR codes and unique codes give the strongest link between a pack and a later action, but only if the destination page is built to capture it.
- Self-reported attribution from checkout surveys catches buyers who never scan anything, and the DMA's research library is a sensible starting point for engagement questions.
Which attribution methods can a pack realistically use?
Packaging is a physical medium, so it cannot rely on the browser cookies that carry digital campaigns. The methods that work fall into two groups. Behavioural tracking uses a code or QR link to create a traceable path. Self-reported attribution asks the buyer what influenced them.
Behavioural vs self-reported attribution
Behavioural tracking
- Method
- QR, short code, redemption
- Trace
- Code creates traceable path
- Blind spot
- Only credits scanners
- Best for
- Pack and print decisions
Self-reported attribution
- Method
- Checkout question, survey
- Trace
- Buyer states influence
- Blind spot
- Only credits honest recall
- Best for
- Placement and message tests
Behavioural methods include unique QR codes per print run, short codes typed into a landing page, and redemption codes tied to a loyalty account. Self-reported methods include a checkout question asking where the buyer first heard about the product, and post-purchase surveys sent by email.
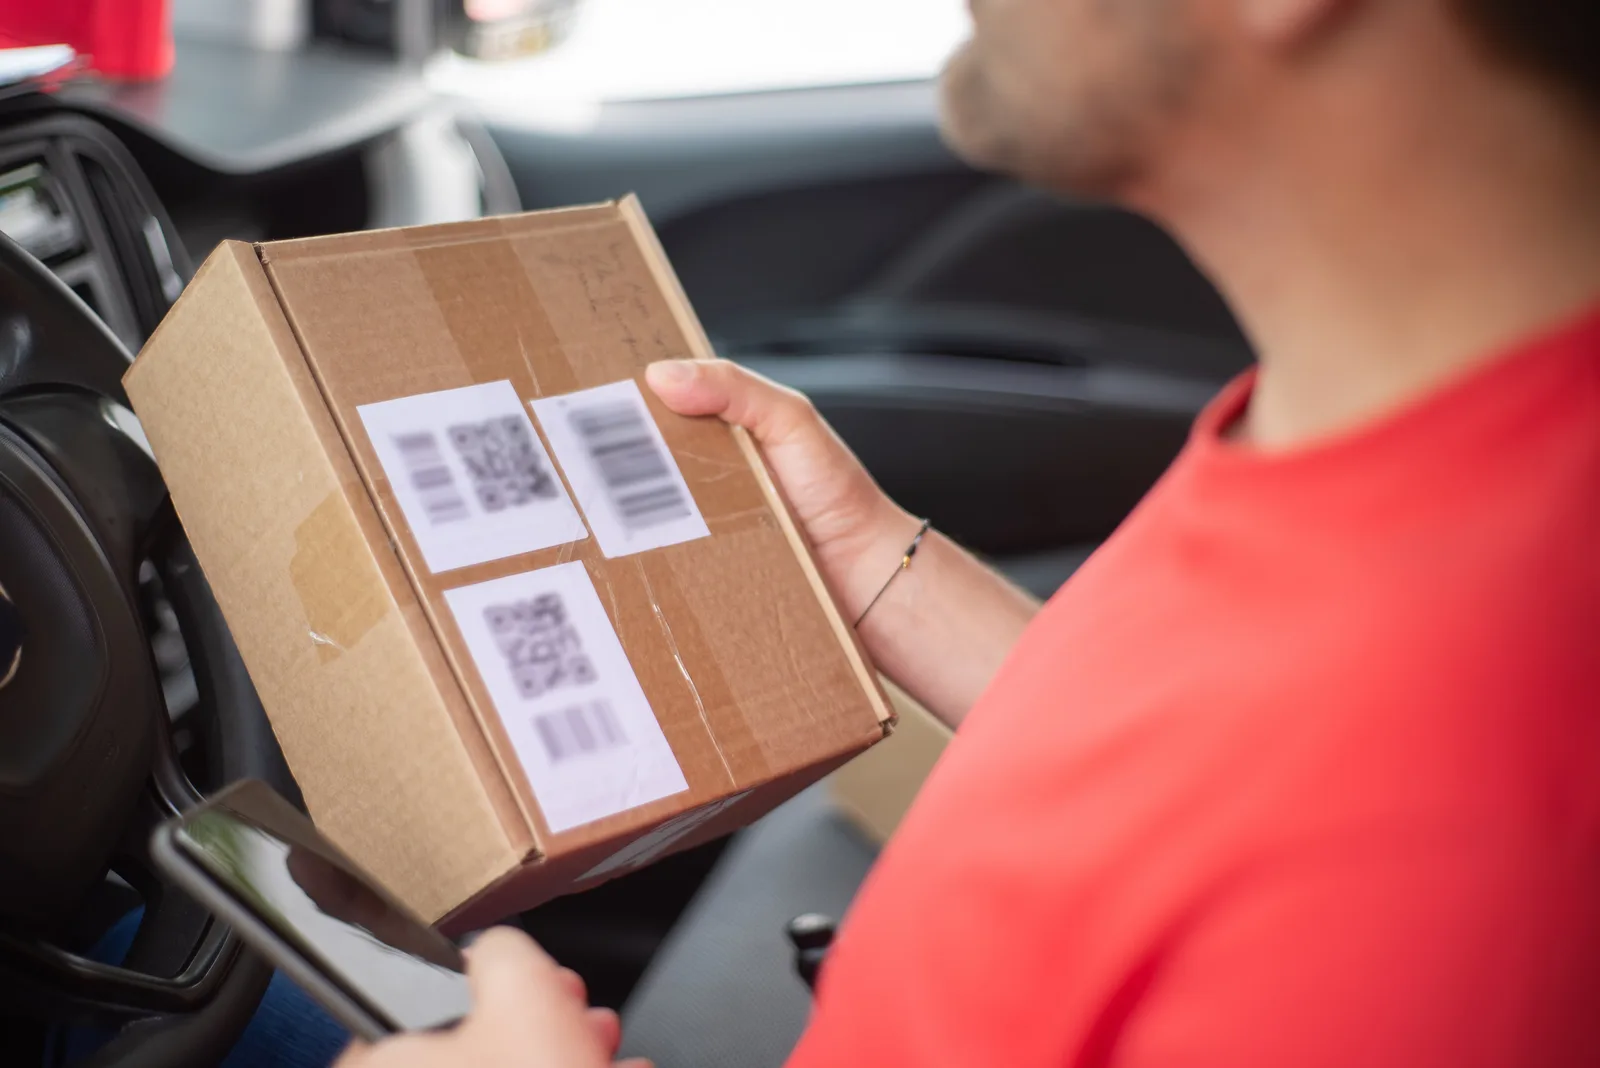
Per-unit QR codes give the most direct behavioural reading. Static codes are free from most generators. Dynamic codes can be repointed without a reprint and typically cost £5 to £30 a month, with scan counts and rough location attached.
Bitly sells dynamic codes with paid plans from around £8 a month. QR Code Generator keeps static codes free and charges for the dynamic kind. Both hold scan data in their own dashboards, so export it into the pack report instead of leaving it sitting there.
Export a CSV of scans by date and destination from each dashboard, then match the code label to the print run and paste the counts into one row per pack in your report.
The landing page decides how much you learn. Google Analytics 4 is free and can tag each print run with its own campaign parameters. Plausible Analytics charges from around £8 a month for 10,000 pageviews. Matomo is free to self-host, and its cloud plans typically start under £20 a month.
GS1 UK issues the GTIN barcode that already sits on most grocery packs, from around £50 a year for a single licence. GS1 Digital Link turns that same barcode into a web address, so a shopper can scan the pack in their hand without a second, printed code.
Digimarc Barcode hides a watermark in the printed artwork for supermarket scanners to read. It is licensed per retailer and quoted per project, with no public price list, which keeps it out of reach for small brands and short runs.
Redemption codes tied to a loyalty account credit the buyer, not the pack. Tesco Clubcard and Nectar both run on-pack points promotions, and the scheme generally returns aggregated redemption counts to the brand rather than person-level records.
Ask the loyalty scheme for redemptions by promotion code and date, then compare that total with the number of packs printed for that code.
Checkout and post-purchase surveys catch buyers who never scan. Typeform's free tier covers 10 questions and 10 responses a month, with paid plans typically £20 to £25 a month. Shopify apps such as KnoCommerce and Fairing typically charge £20 to £30 a month for one post-purchase question.
Paid consumer panels are the slower option. Attest sells UK research on subscription, and Prolific requires researchers to pay participants a set minimum hourly rate, so a 100-response study usually runs into the low hundreds of pounds. YouGov and Kantar Profiles also run UK consumer panels and quote per project.
The table below compares the named tools on method, published price and the job each one suits.
Named tool or service
- Static per-unit QR code
- QR Code Generator
- Dynamic QR code
- Bitly
- Tagged landing page
- Google Analytics 4
- Privacy-first analytics
- Plausible Analytics
- Self-hosted analytics
- Matomo
- Barcode to URL
- GS1 UK Digital Link
- Invisible watermark
- Digimarc Barcode
- Loyalty redemption
- Tesco Clubcard and Nectar
- Checkout question
- Typeform
- Post-purchase survey app
- KnoCommerce and Fairing
- Paid consumer panel
- Attest and Prolific
Published or typical price
- Static per-unit QR code
- free for static codes
- Dynamic QR code
- from around £8 a month
- Tagged landing page
- free
- Privacy-first analytics
- from around £8 a month for 10,000 pageviews
- Self-hosted analytics
- free to self-host, cloud typically under £20 a month
- Barcode to URL
- from around £50 a year for a single GTIN licence
- Invisible watermark
- quoted per project, licensed per retailer
- Loyalty redemption
- scheme-set points rates, aggregated counts returned
- Checkout question
- free tier of 10 questions and 10 responses a month, paid typically £20 to £25 a month
- Post-purchase survey app
- typically £20 to £30 a month
- Paid consumer panel
- subscription; Prolific pays participants a set minimum hourly rate
Where it fits
- Static per-unit QR code
- one print run, one design question
- Dynamic QR code
- repointing a code without a reprint
- Tagged landing page
- campaign parameters per print run
- Privacy-first analytics
- small brand dashboards
- Self-hosted analytics
- teams with their own server
- Barcode to URL
- grocery packs that already carry a barcode
- Invisible watermark
- large retail runs with a scanner partner
- Loyalty redemption
- repeat purchase on a retailer's scheme
- Checkout question
- one self-reported question
- Post-purchase survey app
- Shopify stores
- Paid consumer panel
- a quick read on UK consumers
Each group has a blind spot. A QR code only credits buyers who choose to scan. A checkout question only credits buyers who answer honestly and remember. Read Packaging marketing measurement mistakes before you pick one, because most reporting failures start with a single method being asked to do too much.
How do you compare methods without overspending?
Pick the method that changes a decision you are about to make. Sophistication is not the test. If the decision is whether to keep a pack design, a QR scan rate per thousand units is enough. If the decision is where to place a seasonal insert, a checkout question may be faster and cheaper.
Pick method by decision
What decision will this change?
Keep pack design -> unique QR scan rate
Place seasonal insert -> checkout question
Cost matters too. A unique code on every unit adds print and data work, typically pence per pack on long runs and more on short ones. A single campaign QR on the outer case is cheaper, but it credits the whole case.
The tool bill is not the same as the value. A team paying £400 a month for a survey tool may get more usable answers than one paying £1,200 for a scan platform nobody opens.
Compliance is part of the comparison. Any code that leads to a data capture page has to meet UK data protection expectations. BSI's market access guidance on product compliance for packaging is a useful check that your pack and its digital layer stay aligned.
Choose
- Single SKU, one print run, clear design question
- One dynamic QR code per print run (Bitly or QR Code Generator) with a dedicated landing page
- Multi-channel retail, no direct buyer relationship
- Checkout survey wording agreed with retail partners (Typeform or the retailer's own panel)
- Low scan rates but strong repeat purchase
- Loyalty redemption codes, such as a Clubcard or Nectar points code on pack
- Small budget, first measurement attempt
- One self-reported question plus one code
- Regulated product with strict claims
- Compliance review before any code goes to print
- Barcode already printed on pack
- GS1 Digital Link so the existing GTIN resolves to a URL
Avoid
- Single SKU, one print run, clear design question
- Full multi-touch attribution modelling
- Multi-channel retail, no direct buyer relationship
- Assuming retailer data will be shared
- Low scan rates but strong repeat purchase
- Judging the pack only on scan volume
- Small budget, first measurement attempt
- Buying a platform before the question is defined
- Regulated product with strict claims
- Adding codes late in the print cycle
- Barcode already printed on pack
- Printing a second, unrelated code
What does the evidence base look like?
Official data helps you set expectations rather than prove a single campaign. The ONS digital economy releases cover e-commerce adoption and IT usage, which is the context in which a pack code will be scanned or ignored. Use it to size the online share of your audience, not to claim a scan rate.
The 94.8% figure comes from the ONS Internet users, UK: 2020 release, published 6 April 2021. It is a historical benchmark for how many UK adults were reachable online at all, and it says nothing about whether they will scan a pack.
Evidence base rules
- ONSsize online audience share
- ONSnever claim a scan rate
- DMAcite named study with date
- DMAtreat as benchmark, not promise
- Report attribution as directional only
- Write the limitation into the report
For engagement evidence, the DMA's research library collects studies on customer engagement, including its Customer Engagement report 2024 (published in 2024), built on a survey of UK consumers. Treat any figure you take from it as a benchmark from a named study with a date, never as a promise about your own pack.
Packaging attribution is directional. It tells you which pack or message deserves another test, and it rarely produces a precise return on investment. Write that limitation into the report so nobody downstream treats a scan count as revenue.
Should you build a dashboard or a single report?
Start with a single report that answers one question per quarter. A dashboard built before the question is settled tends to collect numbers nobody acts on. Once two or three quarters show a stable pattern, automate the collection. A free Looker Studio board fed by Google Analytics 4 is enough at that stage.
The wider reporting structure, including how to present pack-level data alongside channel data, is set out in the Packaging marketing: measurement and reporting guide 2027. Use it to keep your attribution method consistent with the rest of your measurement.
Common questions
Can packaging attribution ever be accurate?
Not to the standard of a click on a digital advert. It can be consistent and comparable between print runs, which is enough to support design and budget decisions when you state the method openly.
Do QR codes count as personal data?
A plain QR code that opens a public page does not identify anyone. Once the landing page collects an email address or links to an account, UK data protection rules apply and you need a lawful basis.
How many methods should a small brand use?
Two is usually enough: one behavioural and one self-reported. Adding a third before the first two are reported consistently tends to create work without improving the decision.
What if the retailer will not share scan data?
Use a self-reported checkout question instead, and agree the wording with the retailer in advance.